I came up with a brute force solution.
Haven’t been able to figure out why it doesn’t work though.
Can someone help?
Thanks!
I came up with a brute force solution.
Haven’t been able to figure out why it doesn’t work though.
Can someone help?
Thanks!
programming is basically mathematics and this problem proves it clearly
Area S1 and s2 why?? We have to ignor all the points on X=Y line or what??
Area S1 and s2 why?? We have to ignor all the points on X=Y line or what??
@code01aviraj X=Y line is for test case when t1=0 & t2=0 for rest of cases that is not true
go to this link and u will get the idea
The following book has this problem along with a solution to the simple case when both T1 and T2 are equal.
Digital Dice Book.
With this type of problem it is possible to use the Monte Carlo method to generate some more test answers. This is what I used to finally work out the formula needed.
When you see the editorial and you realize the answer was simpler than you ever imagined it to be.
facepalm
how did that figure come? 
the S1 and S2 areas, I mean!
tried a lot to figure it out, but couldn’t get it! 
could someone please explain?
Thanks in advance!
@rahulkhairwar this is a question which has area consideration. But to understand why it happened you may have look at this link
Any better explanations? Please help!
(@radeonguy) I’ll have a go at explaining it, hopefully it’s helpful.
Person A can arrive any time between 0 and T1. They will wait t1 time before leaving.
Person B can arrive any time between 0 and T2. They will wait t2 time before leaving.
There are four cases
Person A arrives, waits and then leaves before person B arrives. So they never meet.
Person B arrives, waits and then leaves before person A arrives. So they never meet.
Person A arrives, waits and person B arrives before A leaves. So they meet.
Person B arrives, waits and person A arrives before B leaves. So they meet.
The first two cases above match the white areas of the diagram in the editorial.
The second two cases match the orange areas.
The middle green line is if they both enter at exactly the same time. (Note it’s a line so there is no area so the chance of this happening is zero. I realise this may seem a little counter intuitive.)
If A comes in at time 0 then he will wait until t1 before leaving.
If A comes in at time 2 then he will wait until t1 + 2 before leaving.
…
If A comes in at time T1 then he will wait until t1 + T1 before leaving.
This is the right most orange area. The middle green line is the time that A comes in between 0 and T1.
So from the above we can see that if B comes in more than t1 time after A then they will never meet, again this is the right hand most white area.
The same thing applies for B coming in. One slight difference is that A can only arrive up to T1 time this is why the left most orange area has a different shape from the right orange area.
So if A and B can only meet in the orange area (S1 + S2) and the total time they can arrive is T1 * T2 then we get the answer shown in the editorial.
It’s probably best to draw out a test case and to use actual values. Grab someones passing code and verify that you get the same results.
If something still doesn’t make sense then please ask. Or if I’ve got something wrong please correct me.
I understand the concept of the area of that graph. I don’t understand the programatic approach provided by author. Can anybody explain it ?
@shubham99 you need to idealise all types of situations to code this program. In the normal case the answer is (total area of rectangle - total area of two triangles )/total area of rectangle but in case when waiting time of one person is greater than the total time then always they will meet. And some cases are referred by the figure i have uploaded. You may see this code for more help. View Code.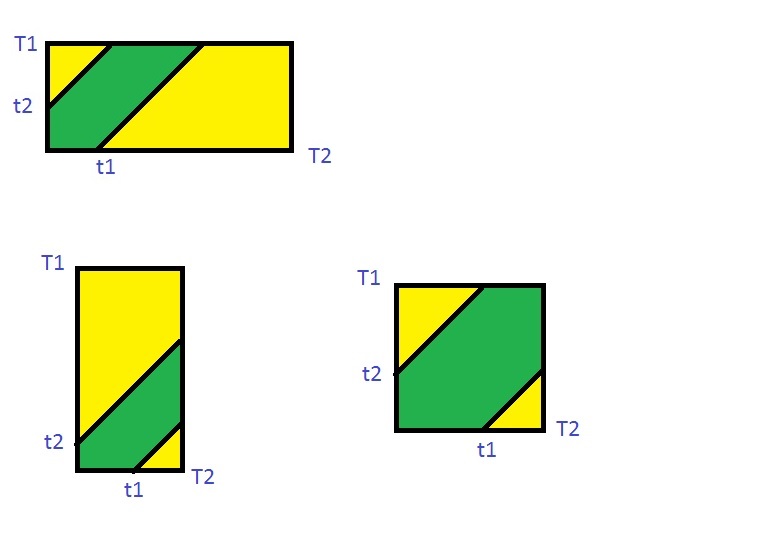
need someone help i m not getting thta how thesse two lines has drawn ,and on the T1 axis why t2 exist,same with T2,
@rohitangira Assume that this question had been given that between time [0 T] only integral time intervals are provided then you may have thought easy to implement it. But here there is continuous variation in time interval so you cant do this. So we can represent this using geometric objects. You can read this . Now to geometrically draw any probability situation you need to know what area should be the total possible outcomes and what area will come under favourable outcomes. The area total that is T1*T2 will be total area of all outcomes.
Now to draw these lines assume person with T2 reaches at 0 so he will wait only till t2 time. So mark a point at 0,t2. Now assume same person if arrived at time x will wait till time t2 so the time when he leaves will be x+t2 mark a point x,x+t2. Now go on marking few points you see they represent a line with slope 45 degree. Since the data is continuous you cant mark all points so just join the complete line. Repeat whole procedure for the person who can arrive between time [0 to T1]. I hope you will be cleared. Comment for more help
t1=0 and t2=0 implies they both meet at the same moment.
There are infinite moments(real numbers) in a range.So the probability of meeting at exactly same moment is zero
Cakewalk might be a relative term (here), for those who have excellent programming skills it may be a cakewalk for them but for an average coder it was not!!
Well , this question was totally related to JEE mathematics ,I guess…
Infact,I had solved it!
Try imagining Pauli’s exclusion principle. 
Maths is indeed important but go out and see the real world. Programming != Maths 