There is no text edutorial for this problem and I am not able to fully grasp the video one. Could anyone explain me the idea (proof would be great too) of solving the problem?
This problem is quite simple, but is stated in a way which makes it seem more complex. The main difficulty is in unpacking the meaning of the problem statement.
I found it helpful to draw a diagram of the tasks with one column per participant, where time increases as you move downwards, each task is shown as a rectangle with height equal to its time, and tasks assigned later are shown below tasks assigned earlier. An example diagram is shown below showing the tasks assigned for the 6th training session, where P1 = P4 = P5 = 1, P2 = 2, and P3 = P6 = 3. Apart from the thick horizontal line representing the start time, the diagram contains six horizontal lines representing the finishing times of sequences of tasks. Their y coordinates are T1, T2, T3, T1 + T4, and so on.
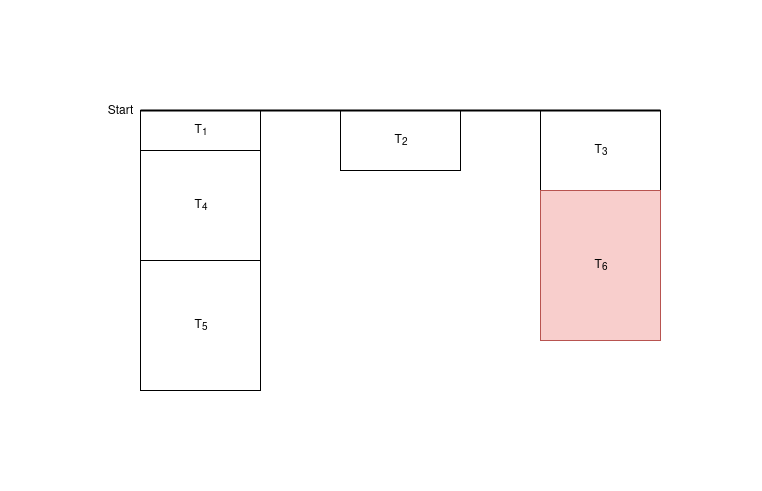
Ignore the red rectangle representing task #6 for a moment to look at the tasks for the 5th training session. To compute ans5, k, we need to find the minimum possible time to complete k tasks. But since tasks assigned later are always longer than tasks assigned earlier, for the quickest possible overall completion of a fixed number of tasks, each participant will choose to do the first r tasks he was assigned, for some value of r; that is, for each participant, his tasks will be completed in the order given by the diagram. This means that, if you want to compute ans5, k, this can be done by moving down in the diagram until you come to the kth horizontal line, since this is the first time at which k tasks have been completed, and taking its y coordinate. So, if we abbreviate the desired sum ansi, 1 + … + ansi, i as f(i), f(5) will simply be the sum of the y coordinates of all five horizontal lines in the diagram below the starting line.
Using this observation, you can see that the only difference between f(5) and f(6) is that the y-coordinate of the bottom of the red rectangle labeled T6, representing the total time T3 + T6 of all tasks assigned participant 3 by the 6th session, has been included in the sum. In general, then, you can compute f(i) as a running total by keeping track for each participant of the total time of all tasks he has been assigned. At step i, Ti is added to the total task time for participant Pi, and then his total task time is added to f(i-1) to compute f(i).
1 Like
Thank you very much! Your explanation is clear and helpful.
It seems that drawing diagrams is crucial in such kind of problems.
I think the main observation here is
Thanks again for your help!!